In the spring of 2004 the faculty adopted by a two-thirds majority vote a set of simple guidelines regarding the grading of undergraduate academic work. Of all the policies I have overseen in my 10 years as president, this has been the most contentious and misunderstood among students, parents and alumni. With the policy now seven years old, I thought it might be helpful to review its original rationale and update you on its impact on grading at Princeton.
Prior to 2004 there was no policy to guide faculty in awarding grades, and over time two worrisome trends became apparent. First, the percentage of “A” grades for coursework rose over the past four decades, from 30% in the 1970s to 32.5% in the 1980s to 43% in the 1990s and 47% in 2001-04. As much as we like to claim that each new class equals or surpasses the talents of the previous class, this increase was not unique to Princeton, but was happening in many secondary schools, colleges and universities. If left unchecked, grades would soon cease to be a meaningful way to provide feedback to students about their academic progress.
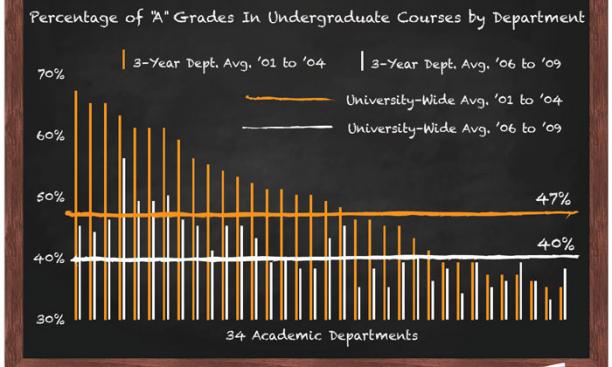
More troubling to me was the fact that the rate of inflation was not uniform throughout the curriculum. As shown in the orange bars in the figure here, “A” grades awarded by departments ranged from 67% at one end of the scale to 35% at the other. The impact of this disparity was clear—students concentrating their academic work in departments at the higher end of the scale had a significant advantage over those at the lower end. This struck many of us as deeply unfair to our students.
In response to this disparity, a faculty committee developed guidelines that were designed to create greater consistency in grading. They recommended that each department aim to award 35% of its grades in the “A” range, as measured using a three-year rolling average of all courses in that department. For independent work, the expectation was that approximately 55% of grades would be “A”s. These targets were never intended to be hard-and-fast quotas; they are University-wide guidelines and goals that, if followed, would yield a consistent and fair grading system for our students. Students would receive “A” grades for “A” work—but only for “A” work—and grading patterns would be more comparable across departments.
What has happened since the policy was instituted? As the white bars in the figure show, grading has indeed become far more consistent across the curriculum, with the average percentage of “A”s across the 34 departments falling from 47% to 40%. A few departments have begun to grade more leniently, and most have brought their grading closer to the Universitywide target. What is little appreciated is the counterintuitive fact that the policy has had little impact on overall GPA s. For example, the median grade point average (GPA ) of the members of the Classes of 2008 and 2009, who experienced four years with the grading policy, was 3.42, while the median GPA for the Classes of 2003 and 2004, who graduated before the policy was in force, was 3.45!
How can both metrics be true? The reason lies in the fact that a significant number of the most heavily enrolled departments, such as politics, economics, philosophy and molecular biology, never changed their grading in response to the new policy because they had been consistently grading in the 35% to 40% “A” range all along. The majority of the departments that had seen their grades rise over time were humanities departments with small enrollments. This small change in GPA s helps to explain why the policy has had no impact on the career outcomes that we are able to accurately measure, such as admission to the top law and medical schools.
If the grading policy has succeeded in its goal of giving Princeton students consistent and accurate feedback on the quality of their academic work, why has it generated so much opposition, with arguments ranging from concerns about a potential competitive disadvantage that our students might face in the job market to worries about the climate for cooperation on campus? Students claim that the policy motivates them to seek courses in which they know they will excel rather than experiment with subjects that are new to them. They also claim that the policy will exclude them from company interviews because their GPA s will fall below arbitrary thresholds.
These concerns are certainly understandable, but they are based on false assumptions about the impact that the policy has had on students’ academic records. The impact has not been to radically lower grades or GPA s; rather grades are now fairly awarded throughout the University, and we know that at least some companies and professional schools appreciate the fact that an “A” at Princeton is really an “A”. I hope this straight talk about the rationale and impact of the policy will help relieve the concerns and allow all of us to take pride in the integrity with which grading is done at Princeton.