John, Paul, George, and ... A's
A statistical model explores grading inequities at Beatle University.
(From “Assessing Inequity in Grading,” by Robert J. Vanderbei, Gordon Scharf ’09, and Daniel Marlow. For the full working paper, see orfe.princeton.edu/~rvdb/tex/grading/grading.pdf)
Introduction: This paper is about statistical techniques for inferring which courses are more grade-inflated relative to others based on information gleaned a posteriori from actual student grades. Suppose a student takes both course X and course Y and gets a higher grade in course X than in course Y. Based on just one student, it is likely that the student simply has more aptitude for the material in course X than for the material in course Y. But, if most students who took both courses X and Y got a better grade in course X than in course Y, then one begins to think that course X simply employed a more inflated grading scheme.
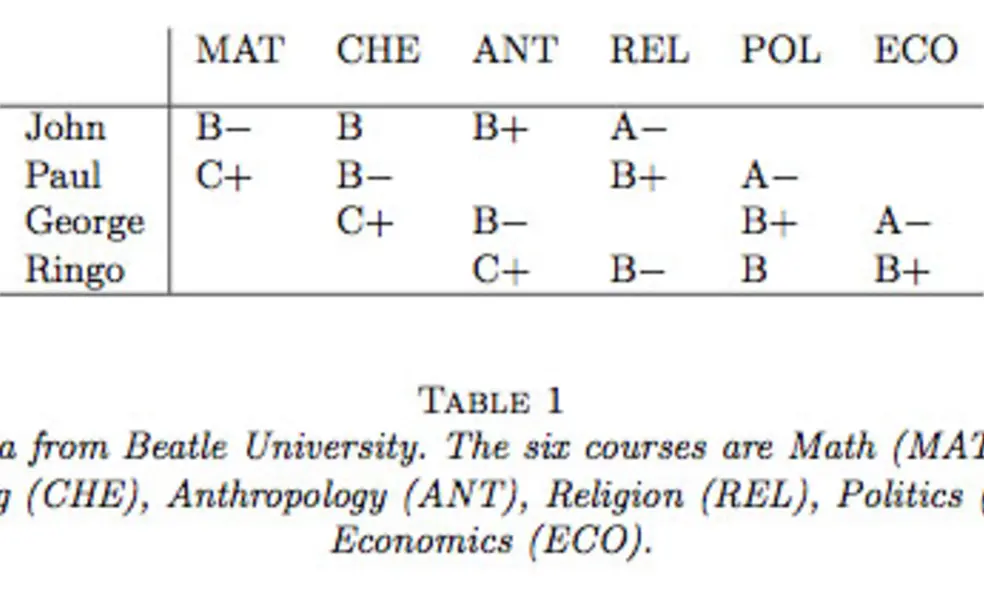
Consider for example, a school with only four students, John, Paul, George, and Ringo. Suppose further that this school only offers six different courses from which the students select four to take. The students made their selections, took the courses, and we now have grading information as shown in Table 1. From this table, we see that George and Paul have received the same grades (in different courses) and so their grade-point averages, i.e. their GPA’s, are the same. Furthermore, John’s grades are only slightly better and Ringo’s grades only slightly worse than average. But, it is also clear that the Math class gave lower grades than the Economics course. In fact, there is a linear progression in grade-inflation as one progresses from left to right across the table. Taking this into account, it would seem that John took “harder” courses than Paul (the quotes are to emphasize that a course that gives lower grades is not necessarily more difficult even though we shall use such language throughout this paper), who took harder courses than George, who took harder courses than Ringo. Hence, GPA does not tell the whole story. John did the best in all of his courses, in many cases by a wide margin. Ringo, on the other hand, did the worst in all of his classes, again by a wide margin. It is clear that John is a much better student than Ringo. Better to a degree that is not reflected in their GPA’s.
Our aim is to develop a model that can be used to infer automatically the sort of conclusions that we have just drawn for this small example. Of course, one must consider the simplest suggestion of just computing averages within each course. Clearly, in Table 1, the Math course gave grades a full letter grade lower than the Econ course. One could argue that that is all one needs – just correct using average grades within each course. But, one can easily modify the simple example shown in Table 1 to make all the courses have the same average grade and all of the students have the same GPA but for which there is an obvious trend in the true aptitude of the students. Table 2 shows one rather contrived way to do this (using an unbounded list of courses and students).
Finally, the model must be computationally tractable so that it can be run for a school with thousands of students taking dozens of courses (over four years) selected from a catalogue of hundreds of courses.


No responses yet