Princeton released this year’s undergraduate admissions decisions on March 28 and reported that a record 35,370 students applied for the Class of 2022; 1,941 were accepted, or 5.5 percent — a record low admit rate.
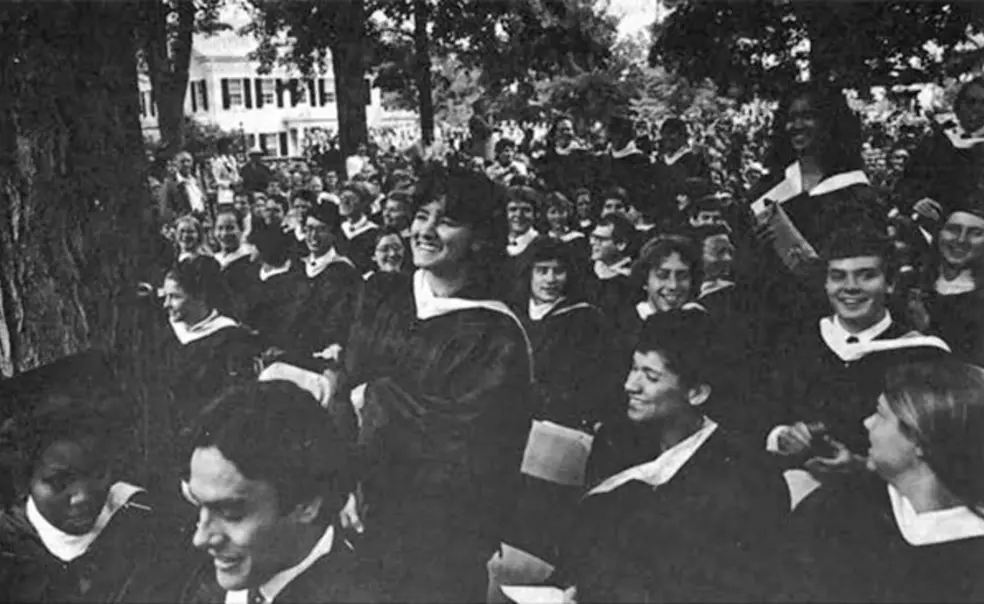
PAW has been sharing admissions statistics since selective admission began, and some things never change: In 1978, Princeton “attracted a record number of applicants and … offered admission to a slightly smaller number.” That was the second year of the University’s first Early Action program, and Princeton admitted 2,222 students, or 20.9 percent of applicants. Of the students offered admission to the Class of 1982, 11.9 percent were children of Princeton alumni; 33.7 percent were women; and 20.6 percent were from minority backgrounds. About 60 percent of the admitted students came from public schools.
Below, read the full admission report for the Class of 1982.
Admissions Trends
(From the May 8, 1978, issue of PAW)
For the third straight year, Princeton has attracted a record number of applicants and — faced with a rising acceptance rate — has offered admission to a slightly smaller number. Applicants were up by 187 to a total of 10,634 while admittances were down by 67 to 2,222 (including the 33 admitted under the Early Action program last December). As a result, the proportion of applicants admitted dropped to 20.9 percent, the lowest since 1970, before the student body was enlarged to its present size.
By reducing the number of admits, outgoing Admission Director Timothy C. Callard ’63 hopes to hold the size of next fall’s Freshman Class to about 1,115. Last fall the number matriculating exceeded that target by 56, creating a housing shortage and forcing the administration to uprate several dormitory rooms to accommodate more students.
The introduction of the Early Action program was one of the factors complicating predictions of the acceptance rate. Traditionally, a little under half of the students admitted have selected Princeton, but the figure now appears to be rising to a little over half.
In the fifth year of the university’s equal-access policy, the male-female ratio seems to be holding even at about 2:1 in both the applicant and admit pools. This year 1,473 men were admitted out of 6,975 applicants, as against 749 women out of 3,659, giving the men a success rate about 0.65 percent higher than the women.
The number of alumni sons and daughters admitted rose slightly to 265 out of 587 applicants, for a rate of 45.1 percent. The number of minority students also increased, to 458 out of 1,766 applicants, or 25.9 percent. The number of applicants for the Engineering School was up by 20 percent.
Of the entire admitted group, more than 92 percent rank in the top fifth of their classes, and about 84 percent are in the top tenth — a rise of 2 percent over last year. Reflecting a national trend, however, their average SAT scores are marginally lower: 649 verbal, 688 math, and 669 for all achievement tests. Some 60 percent come from public high schools and 40 percent from private preparatory schools. Fully 46 percent reside in the tristate area (New York, New Jersey, and Pennsylvania).


No responses yet