
Who’s Asking? It’s Survey Season for Princeton Students


It’s spring on campus, and that means it’s survey season. From last minute thesis research and course evaluations to a behemoth exit questionnaire for seniors, there’s no shortage of surveys trying to capture the opinions of Princeton students.
The end-of-year surveys from the Office of Institutional Research have been assembled over a period of more than 20 years. The questionnaire covers broad ground, from asking about alcohol and drug use to mental health screening questions.
“This has really evolved over time,” Jed Marsh, the vice provost for institutional research, told PAW. Initially, Princeton used surveys written by outside groups. But these surveys didn’t gel well with the University — questions from outside surveys, for instance, focused heavily on fraternities and sororities rather than eating clubs. Gradually, Marsh said, they began to change things up and handle the surveys themselves.
“So we support Campus Life with their strategic indicators and things of that nature,” Marsh said, adding that they also include questions to assist faculty members with their research.
One section at the end of each year-end survey asked students to list the names of their friends and select a ranking for how close the relationship was. This section, added in 2018, Marsh said, was part of a faculty research project about how students form campus relationships.
The survey is also a valuable tool for the Office of Diversity and Inclusion, and increasingly, Marsh said, that his office has tried to gather more information on belonging.
In the 2024 senior survey, Muslims at Princeton reported the lowest belonging score among all religious groups (8.42 on a scale of 0 to 12, with 12 as the strongest sense of belonging) and Jewish students reported the highest score (9.39). In the same survey, students identifying as Native American, Native Hawaiian, or Pacific Islander had the lowest belonging score (6.9) among racial groups, followed by Black students (7.95). White students had the highest belonging score (9.02).
Marsh’s survey group also has to be cognizant of current events. He said his office tries to think ahead so they can ask students about issues as quickly as possible, rather than having to wait until the next year’s survey cycle.
“My group keeps an eye on what’s going on on campus,” Marsh said. Last spring, Marsh said, he looked out his window in Nassau Hall and saw demonstrators. “So we added a bunch of questions around demonstrations [to the survey], and the University supported that,” he said.
The vast majority of students agreed that they felt safe on campus. When broken down by religious identity, Muslim students in 2024 had the lowest percentage of students who either agreed or strongly agreed that they felt safe on campus, with 79%. Among Jewish students, 88% felt safe — for Christians, the number was 90%.
“I am proud of Princeton’s commitment to voluntarily disclose some climate data of another kind that universities rarely share,” Princeton President Christoper Eisgruber ’83 wrote in his annual State of the University letter.
“The risks [of sharing the data] are real, but the data inform the work that we and other universities do to enhance the inclusivity of our campuses. I am proud of the quality of the campus life that Princeton offers to all its students, but I want to see all our students thrive,” Eisgruber wrote. “The disparities in satisfaction levels show where we have opportunities to improve what we do.”
Marsh emphasized that the surveys are constantly subject to change and told PAW that his office is launching a new survey measuring student outcomes. The survey will be sent to alumni every three years for the first 21 years after graduation.
“How essential are those skills [from Princeton] in what you’re doing today?” Marsh explained. “And then following that up, how well has Princeton prepared you in these domains?”
The Latest
See all


Related News

These Three Tigers Are Working to Elevate Pro Women’s Lacrosse
WLL players Marge Donovan ’22 and McKenzie Blake ’25 and executive Rachael DeCecco ’03 see big potential in a new league
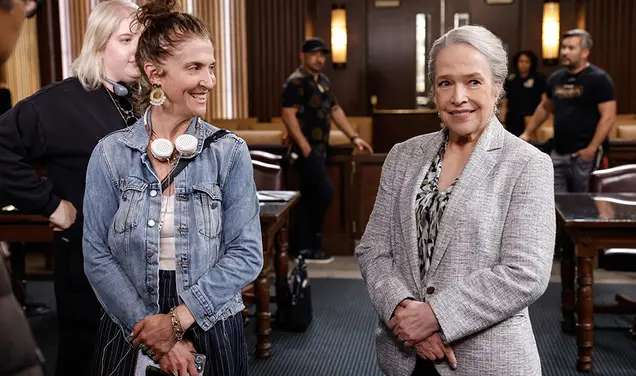
Screenwriter and Producer Jennie Snyder Urman ’99 Brings Bold Women to the Screen
Urman’s fingerprints are on Gilmore Girls, Jane the Virgin, and most recently the Matlock reboot
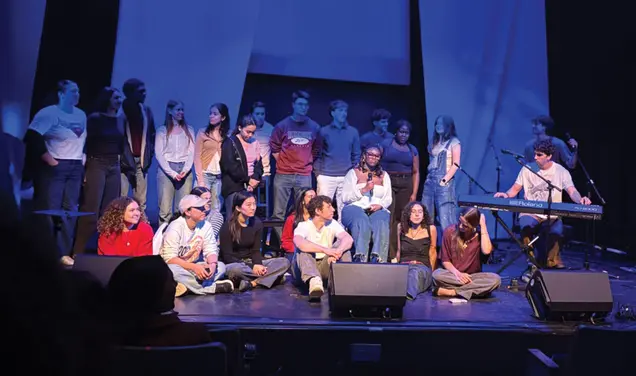
Songwriting Class Is a Princeton Atelier Tradition
Laura Hwa ’26 estimated that she and her classmates collectively wrote around 70 songs this spring

No responses yet