
How Is the Class of 1966 Doing? Reunion Leaders Asked Them.
In a 60th reunion book, class members shared how they feel about the country and the world


The Class of 1966 is marking its 60th reunion this year, but don’t think those guys are stuck in the past. Some 570 members out of an entering class of 806 are still alive. To see how that stacks up, they did what any red-blooded Americans in their mid-80s would do: They asked AI.
Specifically, they posed the following question to four different AI chatbots: “Assume a population of 806 white American males born in 1944. Assume all were still alive in 1966. How many are likely to be alive at the end of 2025?”
The computer-generated answers ranged between 394 and 455. The fact that the class still boasts more than 100 members above the high-end estimate suggests either that they have discovered the Fountain of Youth or that the AI singularity may not be as imminent as some fear. Or that there is something about Princeton that helps people live longer.
The Class of ’66’s 60th reunion book also features a detailed survey of class members, with questions about their lives and how they feel about the country and the world. Here are some highlights (along with some of our favorite responses):
- Number of class members who responded to the survey: 236 (41.4%)
- Living with a spouse or partner: 86.4%
- Widowed: 7.7%
- Average number of children: 2.3
- Average number of grandchildren: 3.5
- Had a joint replacement: 29.4%
- Average number of pills taken per day: 6 or more
- Physical condition negatively interferes with life: 24.6%
- Cognitive decline negatively interferes with life: 6%
- Enjoy “some sort” of sex life: 48.2%
- Do not fear death: 62.1%
- Own a gun: 20.3%
Political affiliation:
- Democrat: 53%
- Independent: 22.4%
- Republican: 11.6%
- Democratic Socialist: 5.2%
- MAGA Republican: 3.4%
Feelings about current political issues (1 = strongly oppose, 5 = strongly support):
- Abortion rights (pro-choice): 4.46
- Affirmative action: 3.64
- Climate change action: 4.22
- Deportation of undocumented immigrants: 2.3
- Enhanced border security: 3.36
- More legal immigration: 3.96
- Same-sex marriage: 4.18
- Tighter regulation of AI: 3.77
- Transgender rights: 3.71
- Feelings about the University’s current direction: 3.82
Happy they attended Princeton: 92.3%
The Latest
See all


Related News

These Three Tigers Are Working to Elevate Pro Women’s Lacrosse
WLL players Marge Donovan ’22 and McKenzie Blake ’25 and executive Rachael DeCecco ’03 see big potential in a new league
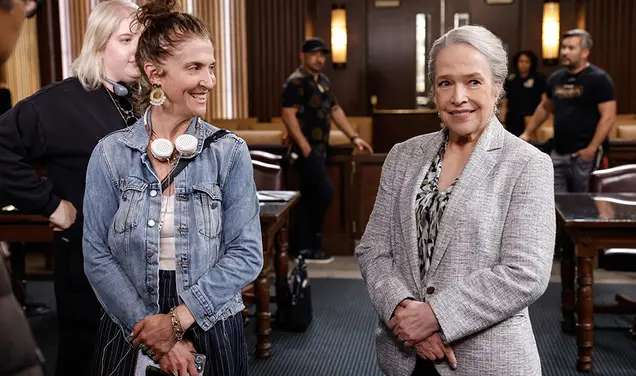
Screenwriter and Producer Jennie Snyder Urman ’99 Brings Bold Women to the Screen
Urman’s fingerprints are on Gilmore Girls, Jane the Virgin, and most recently the Matlock reboot
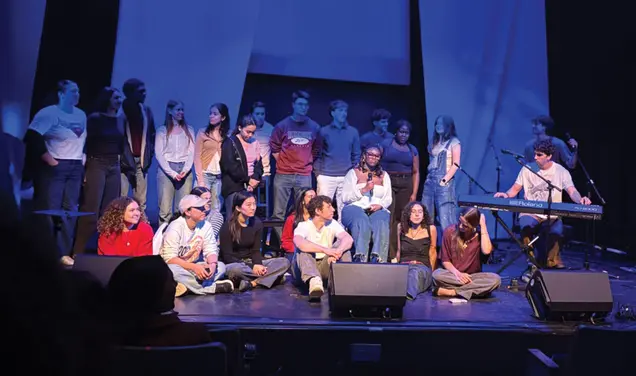
Songwriting Class Is a Princeton Atelier Tradition
Laura Hwa ’26 estimated that she and her classmates collectively wrote around 70 songs this spring

1 Response
Jon Holman ’66
1 Month AgoLongevity Factors for Ivy League Grads
There’s no puzzle as to why ’66 is so long-lived compared to the general population. The same can be said about ’65, ’57, and all Ivy League graduates plus comparable schools. We are better educated, have better medical care, eat more carefully, are less likely to smoke, have better-than-average careers and thus better-than-average incomes. There would be something odd if we weren’t longer-lived than the average American. So the data is totally correct.